Key Adult and Youth Data
Obesity and other diet-related chronic diseases have been increasing throughout the United States for several decades, with stable trends for adult obesity and continuing increases among youth in recent years. Obesity poses a serious public health threat as it is associated with higher mortality and a range of adverse health effects at the population level. This section reviews adult and youth obesity prevalence from the latest available surveys.
National Trends in Adult Obesity
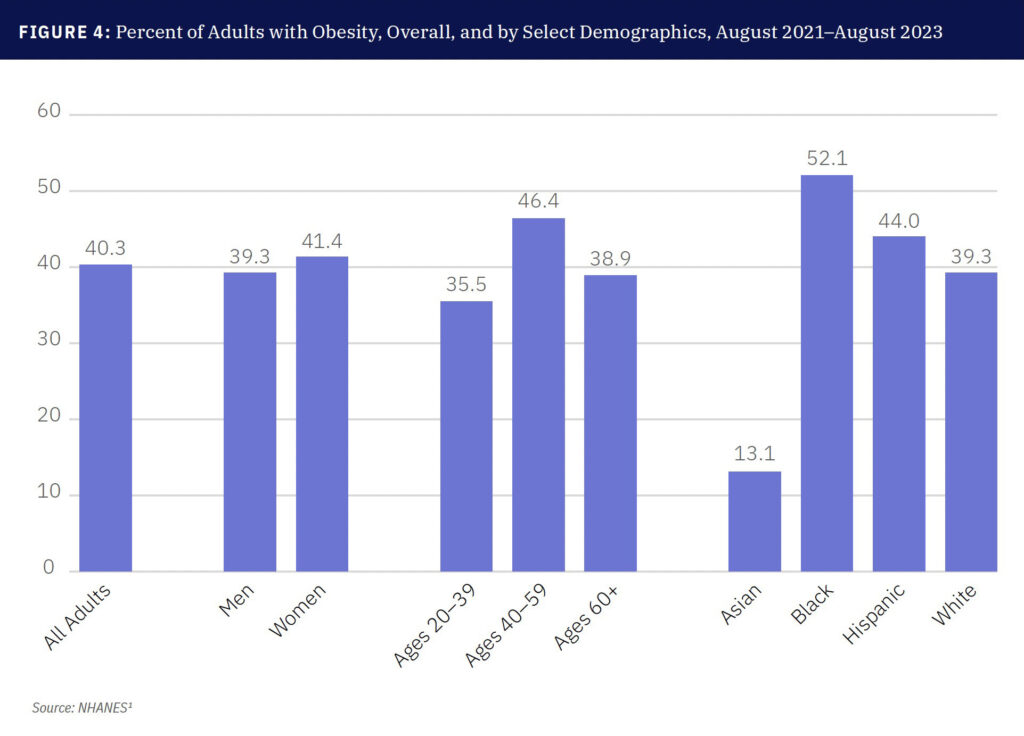
The latest National Health and Nutrition Examination Survey data, from August 2021–August 2023, found the age-adjusted adult obesity rate was 40.3 percent nationally, a non-statistically significant change from the 2017–March 2020 estimate of 41.9 percent. Obesity rates differ across demographic groups, including by sex, age, race/ethnicity, education, income, and geography (see figure below). While obesity rates depend on many factors, economic and community context shape Americans’ daily lives and available choices around healthy food, physical activity, education, jobs, stress, financial security, and other factors that systematically affect people’s weight and health. More data on adult obesity prevalence is available here.
State Trends in Adult Obesity
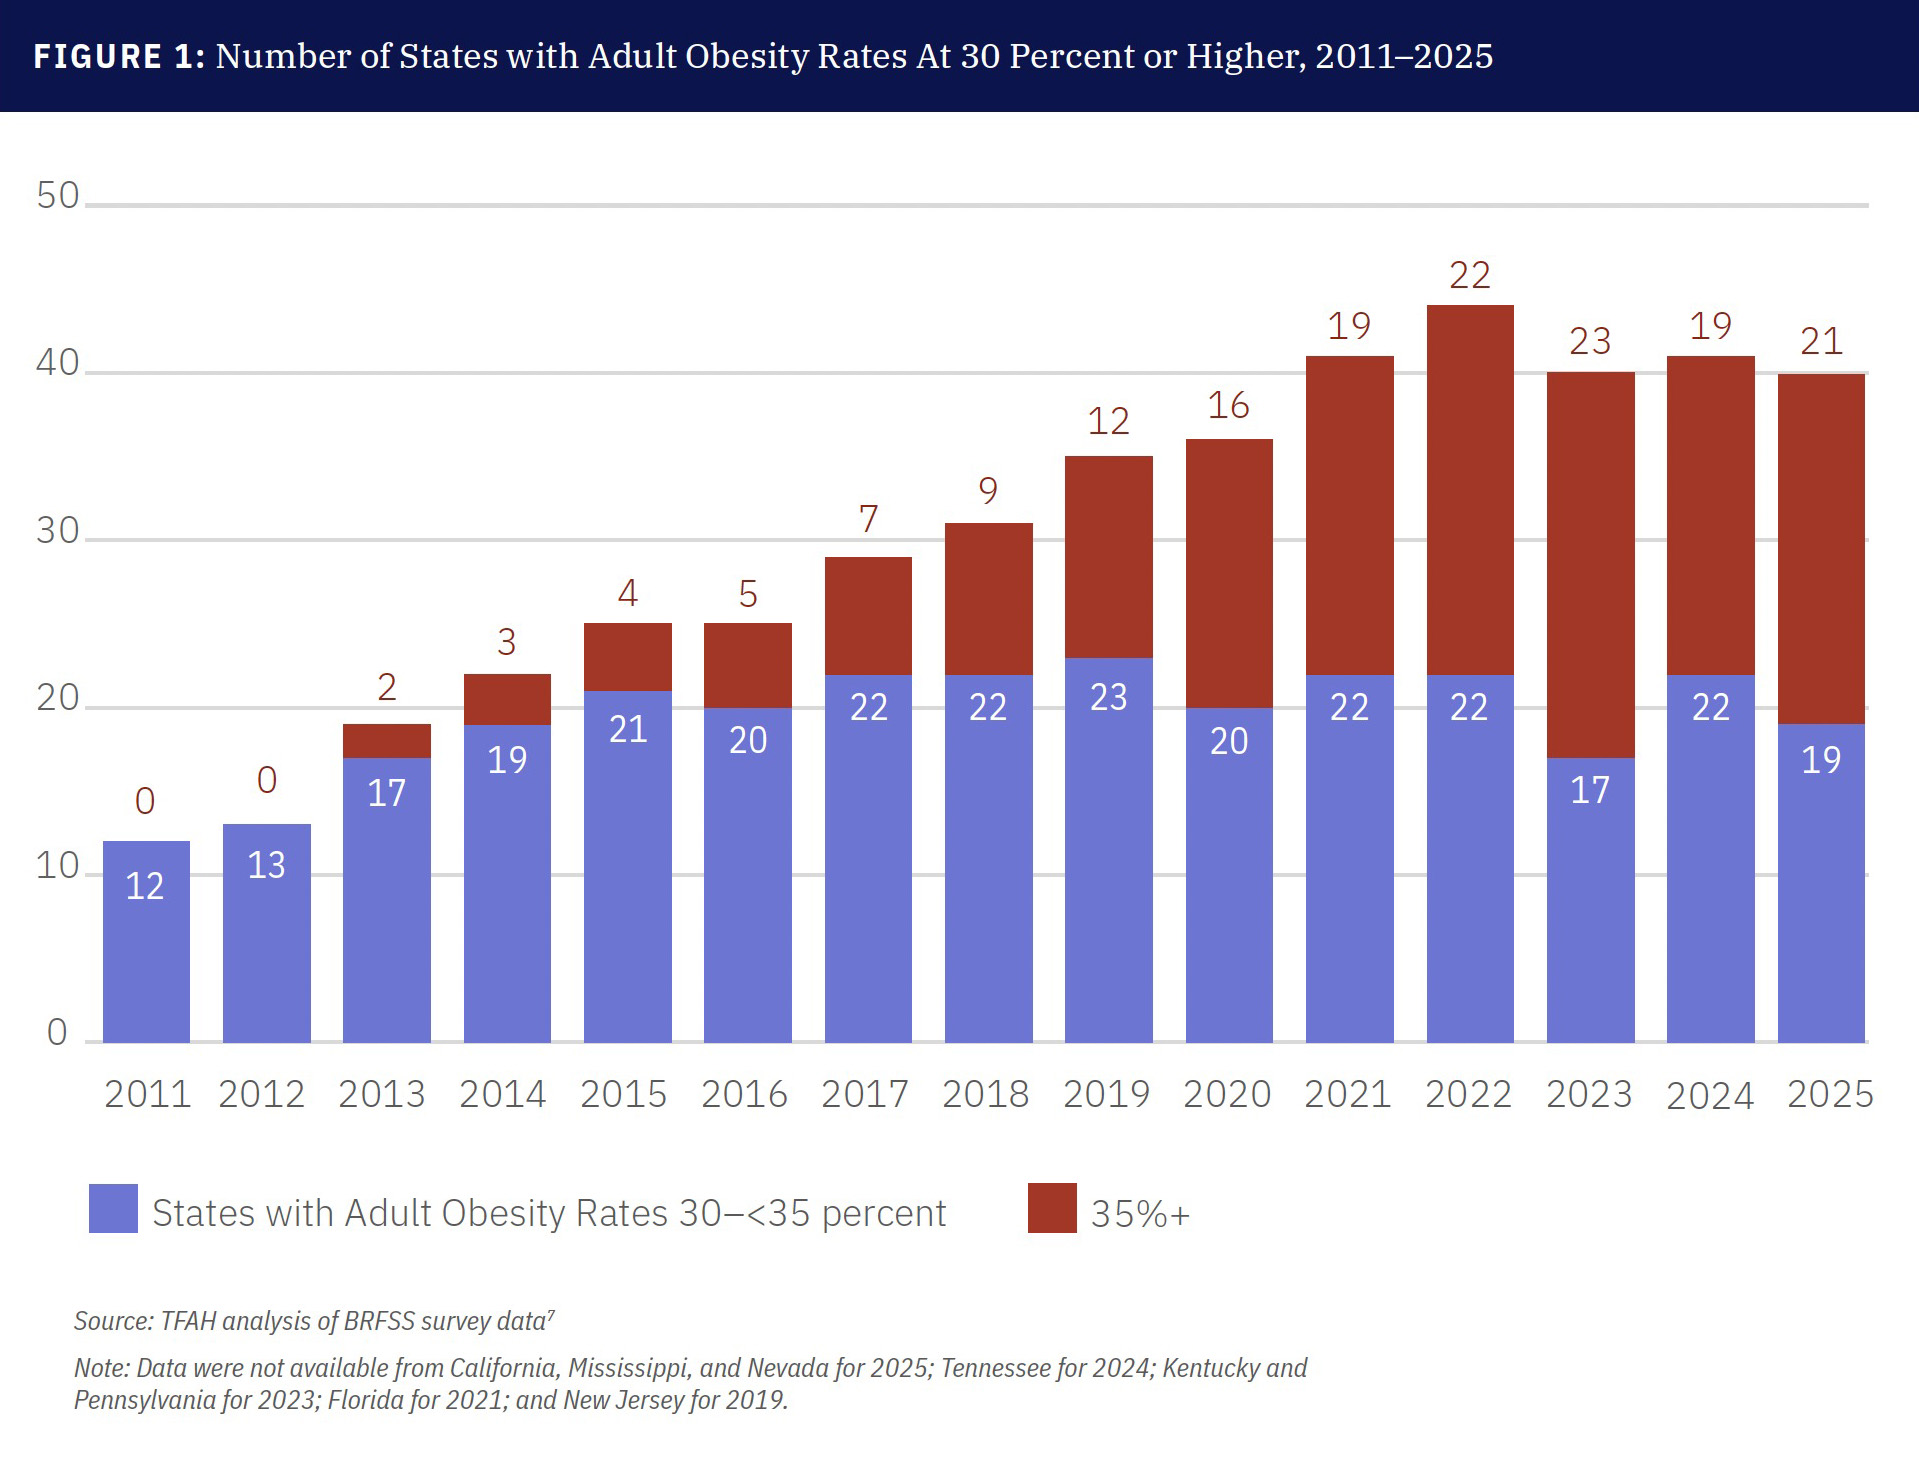
The latest Behavioral Risk Factor Surveillance System data, from 2025, show a second year of stable rates for adult obesity rates, with two states seeing statistically significant decreases between 2024 and 2025, and no states with statistically significant increases. Other topline findings from TFAH analysis of BRFSS data include:
- Differences between states remain considerable, with a low of 25.7 percent in Colorado and 26.4 percent in Hawaii—as well as 24.2 percent in the District of Columbia—to a high of 39.7 percent in Alabama, 39.1 percent in North Dakota, and 38.8 percent in Kentucky.
- In 2025, the adult obesity rate was at or above 35 percent in 21 states—which is between 2024, when 19 states were at or above 35 percent, and 2023, when 23 states were at or above 35 percent. In comparison, in 2012, no states were at or above 35 percent.
- For the first time since 2020, no states had adult obesity rates at or above 40 percent.
- Between 2024 and 2025, two states (Louisiana and West Virginia) had statistically significant declines in their adult obesity rates, and no states had a statistically significant increase.
- Overall, 26 states and the District of Columbia had lower adult obesity rates and 19 states had higher adult obesity rates in 2025 versus 2024 when also considering non-statistically significant changes. One state (Massachusetts) stayed the same, and four states did not have data in either 2025 (California, Mississippi, and Nevada) or 2024 (Tennessee) for comparison.
More data on state obesity rates, including state-by-state rates, is available here.
National Trends in Youth Obesity
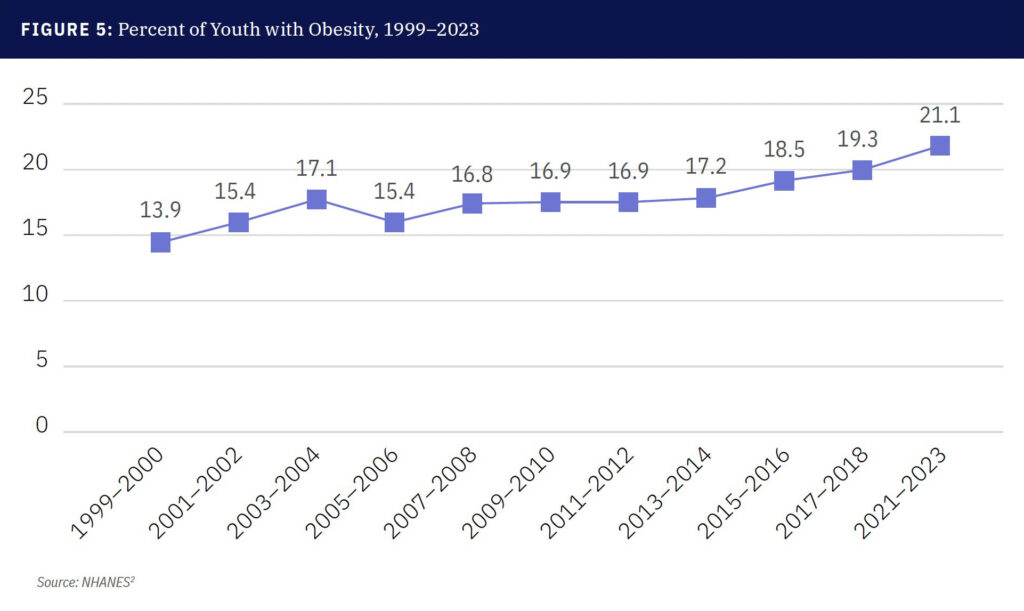
The most recent national data, from the 2021–2023 National Health and Nutrition Examination Survey (NHANES), found that 21.1 percent of youth ages 2 to 19 had obesity. This is slightly above the 2017–2018 survey findings of 19.3 percent. Obesity rates have been rising among children over the long-term, too: between the 1999–2000 NHANES survey and the August 2021–August 2023 survey, obesity rates for children ages 2 to 19 increased approximately 52 percent.
In addition to these overall trends, NHANES includes youth data by demographic groups and TFAH relies on several additional surveys to better understand the full picture of childhood obesity. The 2026 State of Obesity report includes data from:
- The WIC Participant and Program Characteristics Report is a biennial census of low-income mothers and young children (under the age of 5) that WIC serves. The most recent data available is 2020 (the most recent report, from 2022, did not include obesity data due to data collection issues related to the COVID-19 pandemic).
- The National Survey of Children’s Health survey parents of children about aspects of their children’s health, including height and weight for children ages 6 to 17. The most recent dataset available is 2022–2023.
- The Youth Risk Behavior Survey measures health behaviors, including eating habits and physical activity behaviors, as well as a BMI category among students in grades 9 to 12. The 2026 State of Obesity report includes 2023 data, though 2025 survey data has since been released.
More on youth obesity rates from all these surveys is available here.
Obesity-Related Indicators and Policies By State
Read more in the 2026 State of Obesity report.